deck.gl: A High Performance GPU-Powered Visualization Framework.
Introduction
deck.gl is a powerful and versatile GPU-based framework for creating stunning and interactive visual representations of large datasets. It is an open-source tool built on WebGL, which was developed initially by Uber and is now maintained under the OpenJS Foundation.
deck.gl is built to handle large datasets efficiently by leveraging GPU capabilities to render complex visualizations. A major application of deck.gl is its ability to efficiently visualize geospatial data (like maps and 3D scans). It is highly compatible with major base map providers like Mapbox and Google Maps. It also provides interactive event handling like picking, highlighting and filtering, which allows users to interact with individual data points on the maps with ease.
Installation and Setup
To install and run deck.gl on your system, you will need npm (Node.js package manager).
Instructions to install npm on your system can be found here.
To install the deck.gl framework:
The above line should install the deck.gl module, including all the deck.gl features and their dependencies. More detailed instructions about the installation can be found on the deck.gl website
Key Features and Explanation
1. GPU Acceleration
Unlike traditional data visualization libraries that rely heavily on CPU computation, deck.gl enables the rendering of massive datasets directly on the GPU.
2. Layer-based Approach:
deck.gl visualizations use layers as building blocks. Layers accept data and map it to visual elements rendered on the GPU. Each layer represents a specific type of visualization, and these layers can then be combined together to form complex visuals.
The main types of layers are:
- Core Layers
- Aggregation Layers
- Geo Layers
- Mesh Layers
For an exhaustive list of layers, visit the deck.gl Layer Catalog
3. Integration with Mapping Libraries:
deck.gl is highly compatible with mapping libraries like Mapbox, Google Maps, OpenStreetMap.
4. Compatible With Multiple Data Formats:
deck.gl uses loaders.gl to read data and resources. loaders.gl supports various data formats such as CSV, GeoJSON, LAS, 3D Tiles (such as Point Clouds and Batch 3D models), Vector Tiles (such as Mapbox) and many more.
5. Interactivity:
deck.gl has built-in support for zooming, panning, tooltips and hover events.
Code Examples
The following code snippets show how to display a simple map in deck.gl, centred on Vancouver, Canada, and use HexagonLayer to display the number of trees across the city in the form of hexagonal bars. The entire source code of the example can be accessed from here.
The code is written in Typescript and rendered using React. It uses the following imports:
import React from 'react';
import {createRoot} from 'react-dom/client';
import {Map} from 'react-map-gl/maplibre';
import {AmbientLight, PointLight, LightingEffect} from '@deck.gl/core';
import {HexagonLayer} from '@deck.gl/aggregation-layers';
import DeckGL from '@deck.gl/react';
import {CSVLoader} from '@loaders.gl/csv';
import {load} from '@loaders.gl/core';
import type {Color, PickingInfo, MapViewState} from '@deck.gl/core';
First, we render an empty map. For that, we get the map style from Carto. We define some constants corresponding to the source of our map and the public trees dataset.
const MAP_STYLE = 'https://basemaps.cartocdn.com/gl/dark-matter-nolabels-gl-style/style.json';
const DATA_URL =
  'https://raw.githubusercontent.com/Aayush75/ES114-Exposition-Article/refs/heads/main/final_data.csv';
Then, we use a Map component with the mapStyle property set to MAP_STYLE, inside a DeckGL component and then render it using the .render() method on our root HTML element.
function App(/* args */) {
    return (
    <DeckGL
        // options
    >
      <Map reuseMaps mapStyle={MAP_STYLE} />
    </DeckGL>
    );
}

async function renderToDOM(container: HTMLDivElement) {
    const root = createRoot(container);
    root.render(<App />);
}
Now, to add a HexagonLayer on the map, we create a layers array with a single HexagonLayer element. The HexagonLayer constructor takes an object with various properties that modify the characteristics and behaviour of the rendered layer. For convenience and reusability, we have defined a React component called App that does this.
export default function App({
  data = null,
  mapStyle = MAP_STYLE
}: {
  data?: DataPoint[] | null;
  mapStyle?: string;
  radius?: number;
  upperPercentile?: number;
  coverage?: number;
}) {
  // ...

  const layers = [
    new HexagonLayer<DataPoint>({
      id: 'heatmap',
      gpuAggregation: true,
      colorRange,
      coverage: sliderCoverage / 100,
      data,
      elevationRange: [0, 80],
      elevationScale: data && data.length ? 50 : 0,
      extruded: true,
      getPosition: d => d,
      pickable: true,
      radius: sliderRadius,
      upperPercentile: sliderUPercentile,
      material: {
        ambient: 0.64,
        diffuse: 0.6,
        shininess: 32,
        specularColor: [51, 51, 51]
      },

      transitions: {
        elevationScale: 3000
      }
    })
  ];

  // ...
}
The most important properties in the above constructor are
data: an array of pointsgetPosition: a function that gets the coordinates in the form of[<longitude>, <latitude>]from a pointpickable: allows the elements on the layer to become interactiveradius: specifies the radius in metres covered by a single hexagonal bar
For more information about the different properties that can used, see HexagonLayer.
Finally, we can again use the App component to render the layers on the root element.
async function renderToDOM(container: HTMLDivElement) {
    // ...
    const points = // get the points from the dataset
    root.render(<App data={points} />);
}
Here is the output of the example above (the sliders have been added by us and are not provided by deck.gl):
Screenshots
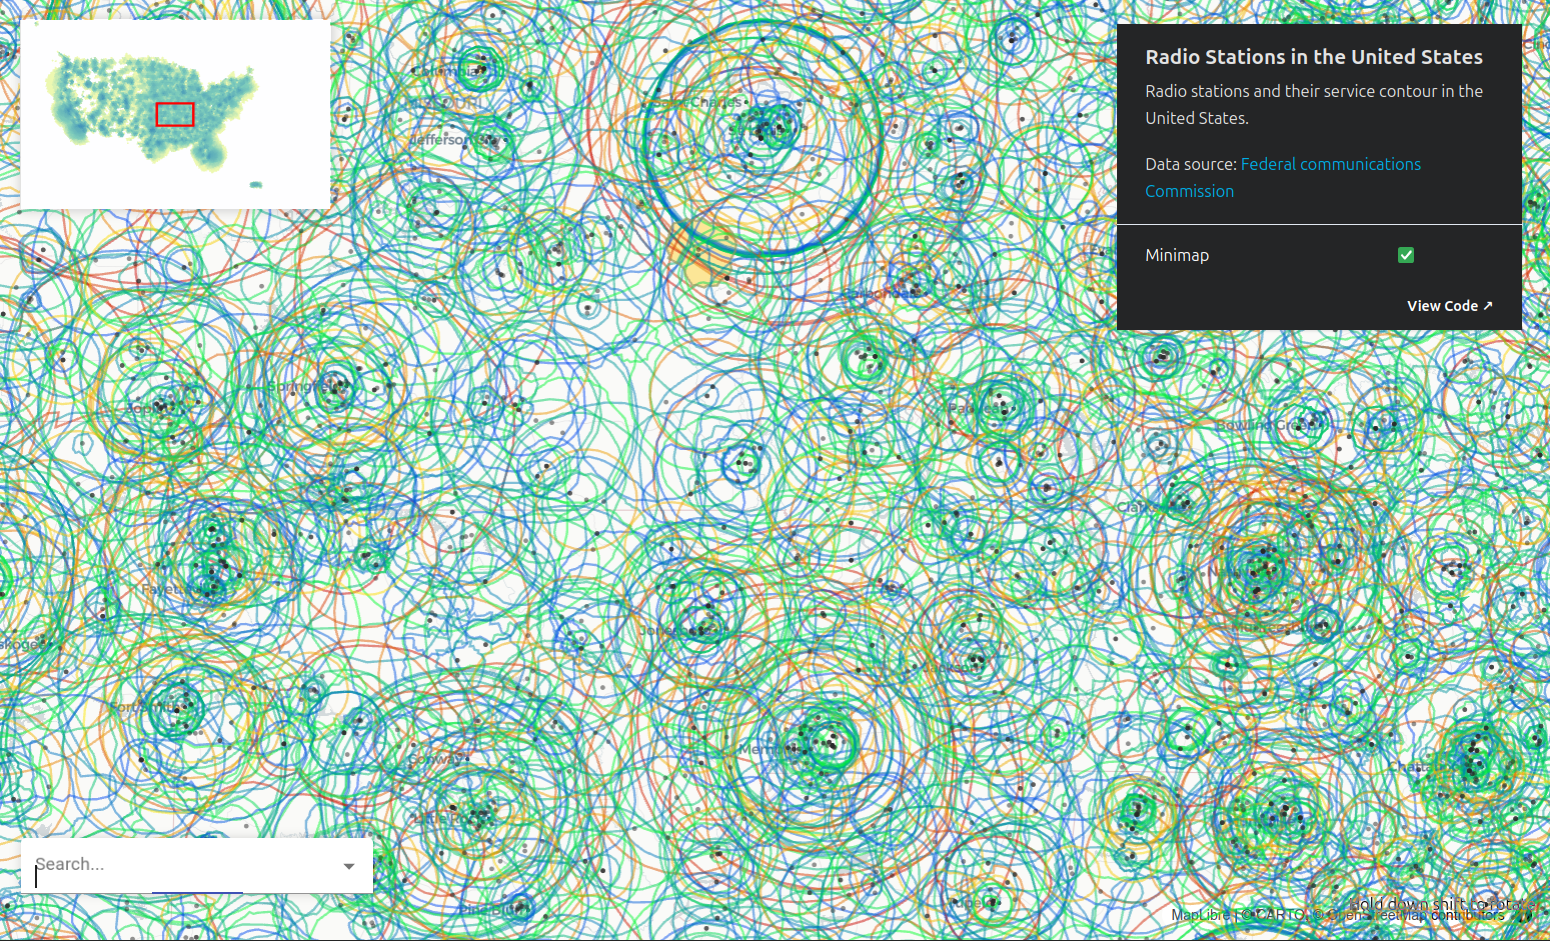
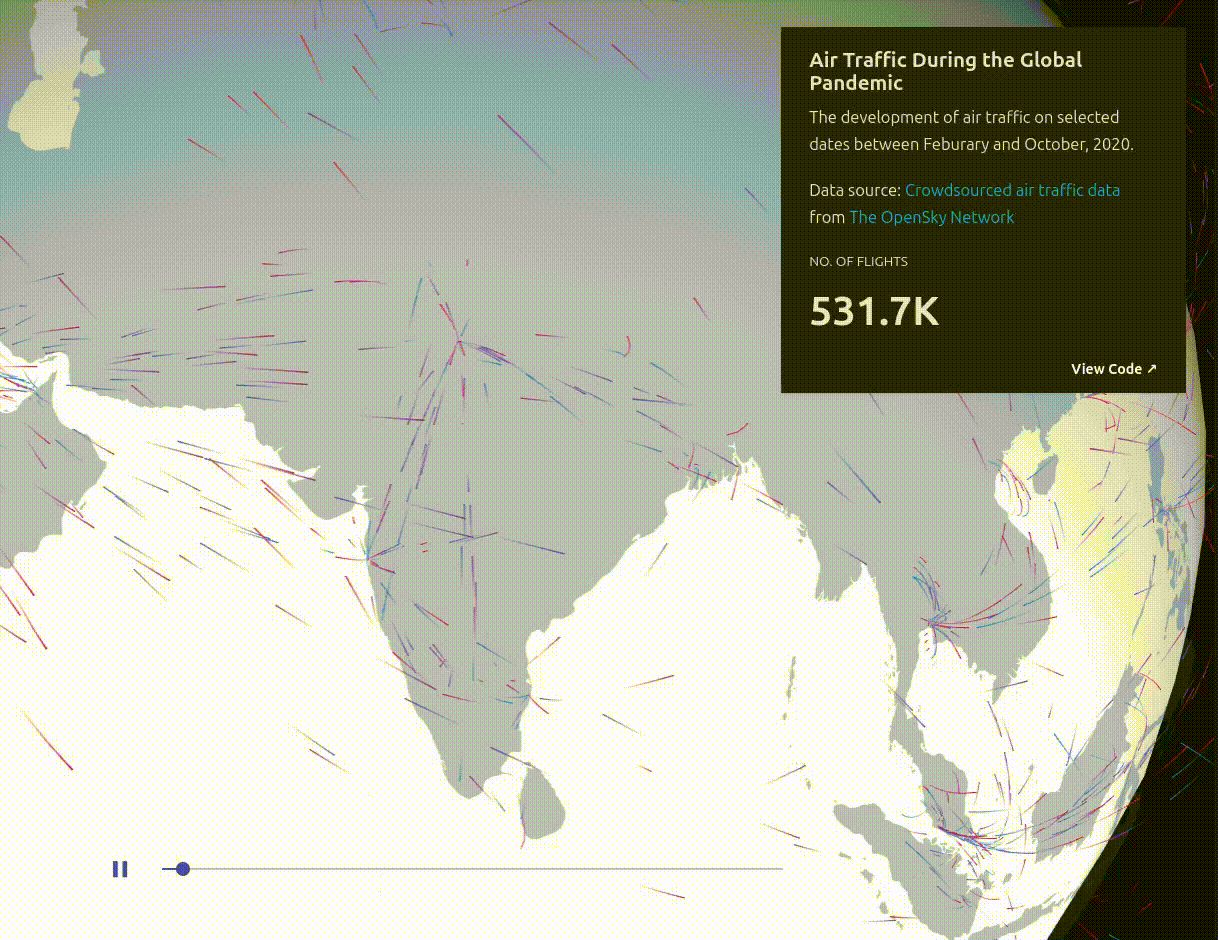
Here are some screenshots of visualizations created using deck.gl:
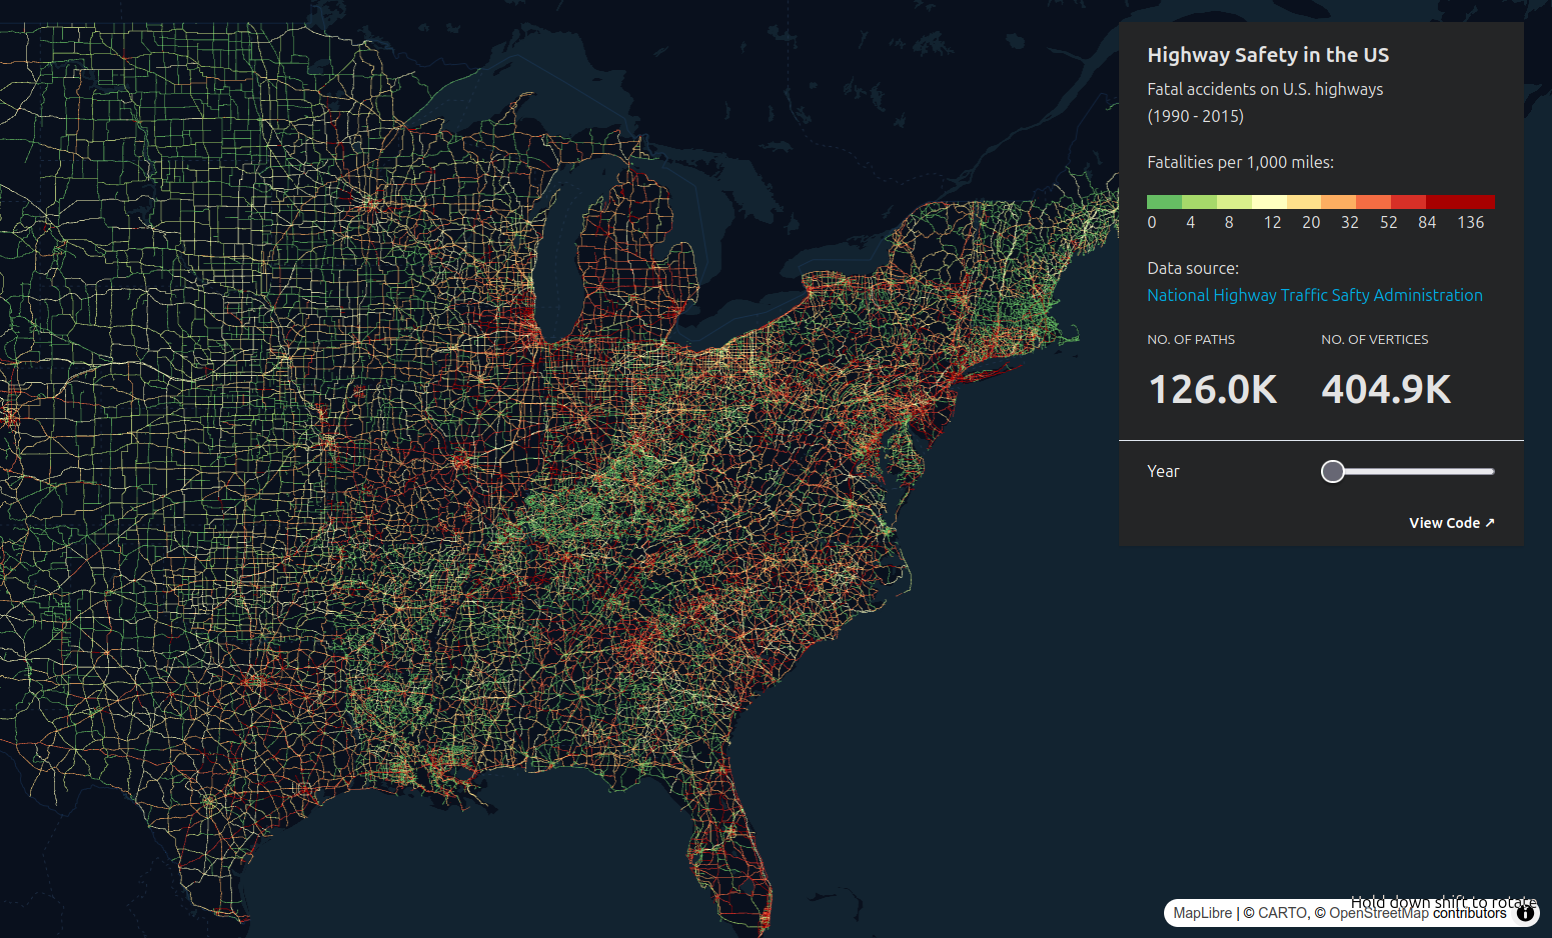
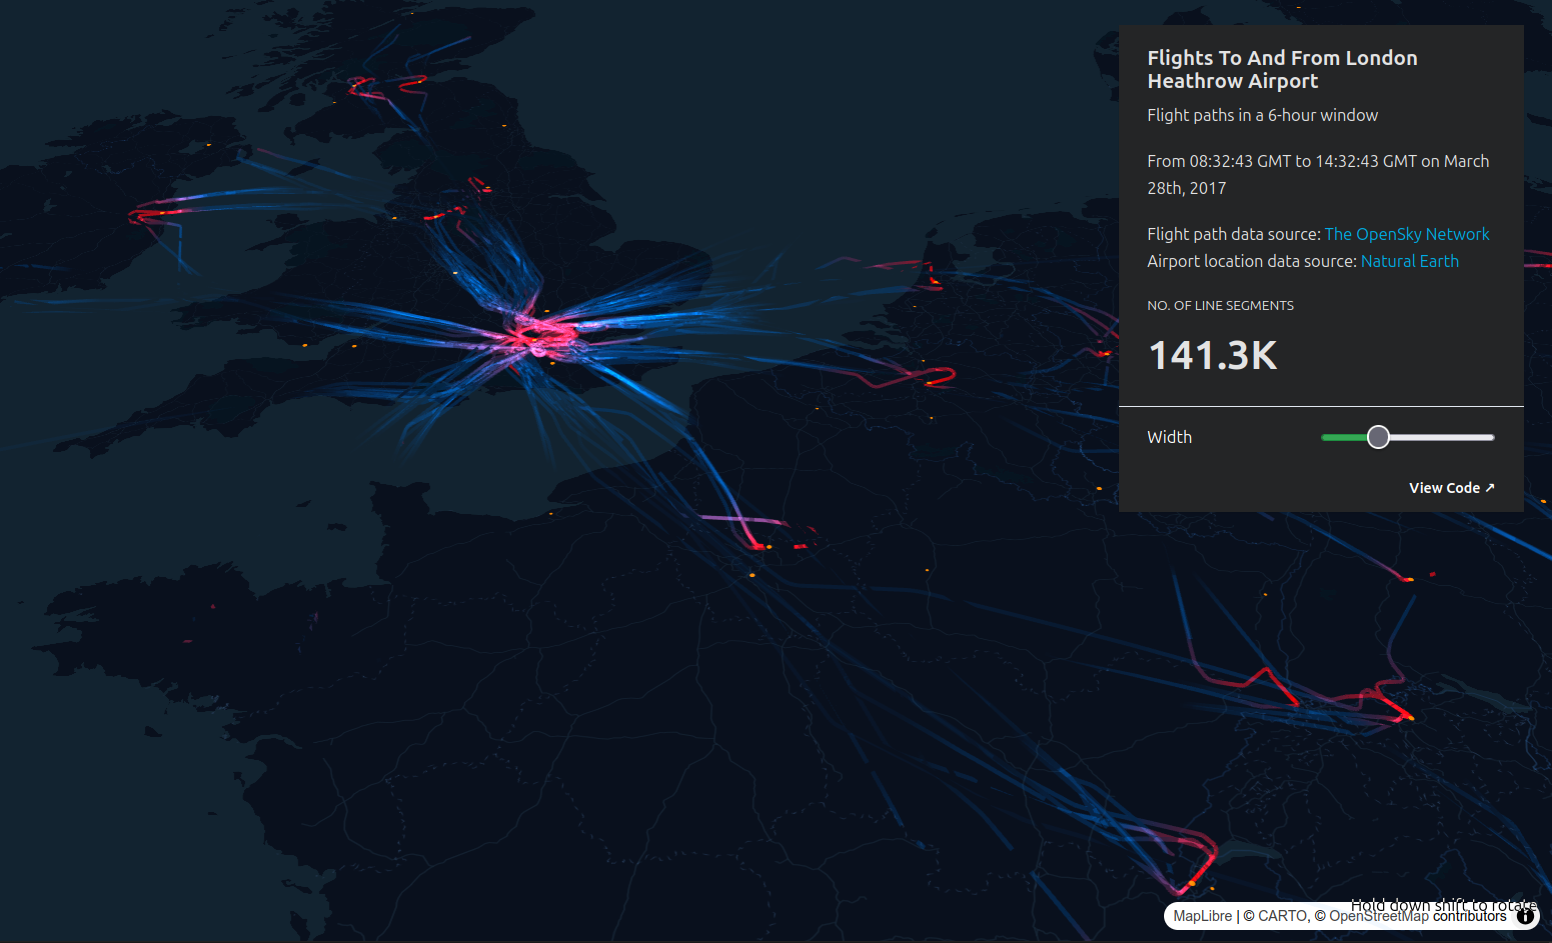
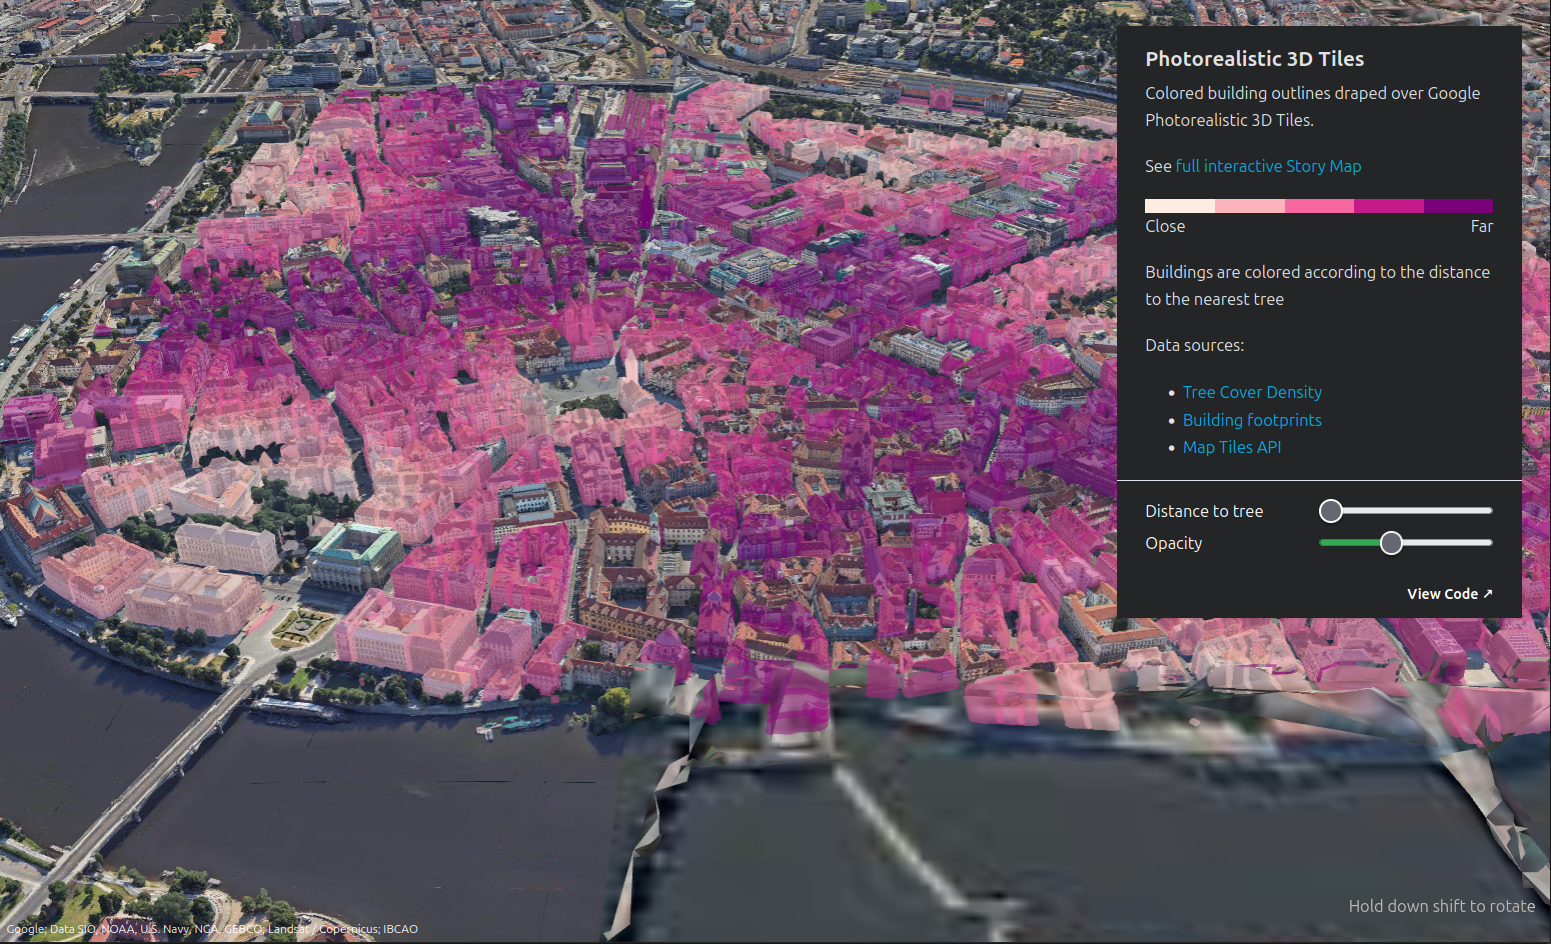
CompositeLayer that renders geometries based on the tile type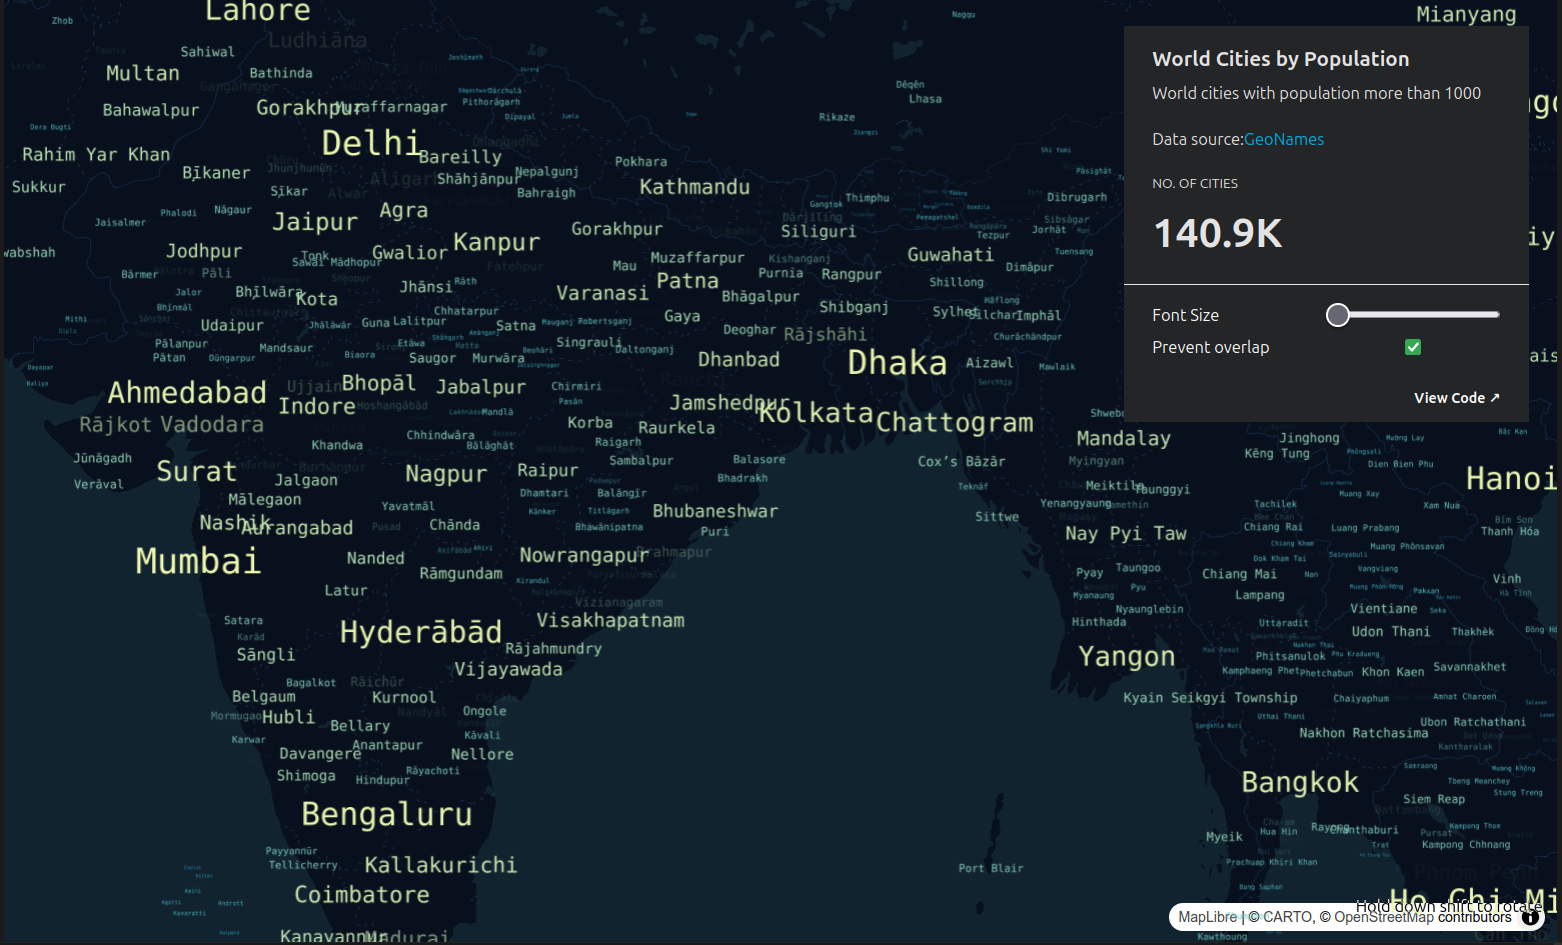
Use Cases
1. Climate Science:
Visualizing weather patterns, temperature variations and environmental changes using animated layers and heatmaps
2. Geospatial Analytics:
Analyzing tree coverage across a city, regions prone to flooding, and land-use planning.
3. Urban Planning:
Analyzing city traffic, infrastructure and property values in different areas.
4. Transportation:
Tracking fleet movements, analyzing air traffic and optimizing routes.
5. Financial and Retail Analysis:
Tracking sales performance, customer distribution and market trends.
Conclusion
deck.gl is a robust and flexible tool for producing beautiful visualizations of big data. It is very effective in rendering sophisticated visuals by leveraging the GPU. It supports many mapping libraries and accepts many data formats. It is an excellent tool for visualizing geospatial data and can be used in a wide range of applications such as climate science, urban planning, and transportation.